For the last year, Tulip has offered machine monitoring applications for improving data collection on the shop floor.
Machine Monitoring was a perfect complement to our human-centric applications, giving manufacturers a way of contextualizing machine performance within complete industrial processes.
Today, we’re excited to announce the next stage in our machine monitoring offering with the release of new features and capabilities.
Why we Upgraded Machine Monitoring
Our new machine monitoring features and improvements are driven by a few key objectives:
- Improve configurability for truly custom machine monitoring solutions
- Increase machine and application data integration for complete process visibility
- Easier, more robust data collection to support advanced analytics like predictive maintenance
- Seamless scaling across departments, plants, and geographies
In the course of our work with customers, we found there was a need for machine monitoring applications that adapt to the unique conditions of every shop floor. Further, we confirmed our initial hypothesis that machine monitoring is most effective when, 1.) it accounts for the place of machines within processes with significant human and mechanical elements, and 2.) it effortlessly scales from one machine to 5 to 500.
Our new features make this a reality for manufacturers of all sizes.
New Machine Monitoring Features
In addition to improved performance across the board, here’s what you can expect from machine monitoring with Tulip.
Source Normalization for Custom Machine Types and Attributes
With Tulip’s machine monitoring, you define specific machine types to capture the data that matters most to you.

Machine type is a collection of attributes–or, name/value pairings. Each instance of a type connects an attribute to a specific data source. This makes scaling and standardizing across operations significantly easier.
For example ‘spindle speed’ is a numeric attribute that will map to a specific node in an OPC/UA for a configured machine. Every machine type that uses the attribute “spindle speed” will thus implement it identically, preventing formatting discrepancies like ‘spindleSpeed’, and ad hoc abbreviations like ‘sp.speed’.
This makes it possible for users to normalize definitions of a machine for streamlined access to analytics. It makes it possible to effortlessly expand solutions across your operations.
Custom State Machines
Tulip machine monitoring gives you the ability to design custom machine states.
In practice, this means that you can define custom machine states based on changes in machine attributes.

An engineer overseeing a department of CNCs, for example, might want to consider the machines RUNNING if spindle speed is above 10, IDLE if above 1, and in all other cases consider them NOT RUNNING.
Another engineer might want more granular state data. In this case, she could add states named “Too Slow,” “Outside Norm for Program,” or “Feedrate Above Threshold” to correspond with custom-defined spindle speed ranges.
These states can be tied to triggers, custom machine attributes, and other applications, giving you exactly the information you need to make the most informed decisions.

Machine and app data integration
Each new feature works with existing Tulip Tables infrastructure.
Every change in state causes a new row to be inserted in the table for that machine type. This allows users to use the same features we built for tables to add custom annotation data to historical machine data.
You may want to add a “parts counted” column or downtime reason to your tables. Using applications and MMV2 together you can define exactly how triggers within applications can append this data to machine history records.
This data integration makes it possible to identify root causes for accurately and to uncover new opportunities for improvements.
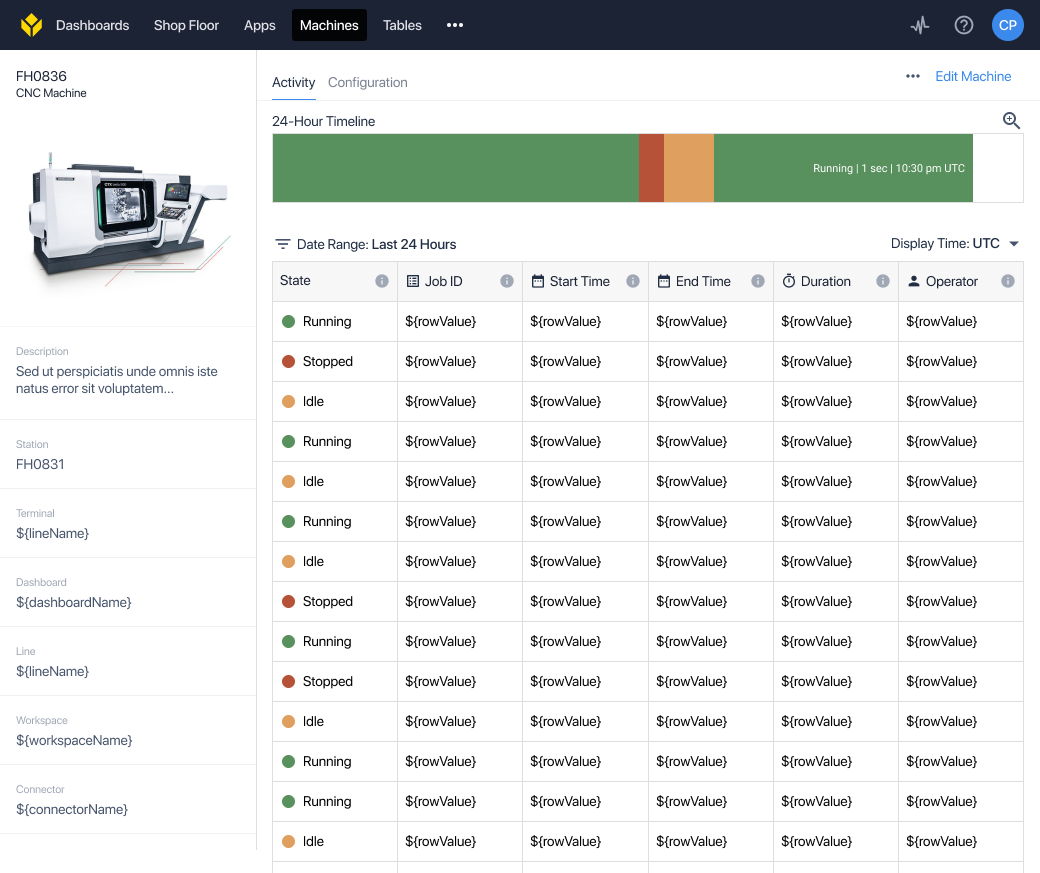
Meaningful data out of the box
Once a user has configured a machine, the platform makes this data available without needing to configure custom dashboards.
The same state snapshot and state timeline views can also be embedded in dashboards and apps for custom dashboard use cases.
How to Get Started
All new features will be available in mid-January 2020.
To find out how machine monitoring with Tulip will transform how you collect data on the shop floor, get in touch today.