What is Throughput?
Throughput is the amount of product that a company can produce and deliver to a client within a specified time frame. It is often understood as the rate at which work is done, and the amount of goods produced during a machine run.
Throughput is a tried-and-true manufacturing KPI because it allows manufacturers to track production against capacity and demand.
It’s also important because low throughput cuts directly into profits.
Why is Throughput Lower than it should be?
It can be hard to diagnose whether or not your operations are truly operating at capacity. Without visibility, it’s even harder to determine exactly why throughput is low.
So what exactly is keeping your operations from reaching that potential?
Some common bottlenecks can throw off the production rhythm in many ways. It helps to start with those:
- Assets with unidentified throughput problems can create problems downstream
- Inefficient workers can cause production errors and downtime
- Paper-based workflows can lead to slow execution
- Problems in the supply chain impact production
These can all throw production sequences out of alignment and slow down the rate at which work is completed. If you’re looking for a root cause, these inefficiencies are a good place to start.
So how do you address these causes of low throughput?
How to Increase Throughput with Real-Time and Historical Data
Production visibility is the key to increasing throughput.
If you can’t identify the source of a bottleneck, you can’t fix it. If you’re not able to pinpoint exactly where and why production is falling out of balance, your lines will never produce at capacity.
That is why it’s essential to collect real-time production data that can serve as a source of truth.
The most efficient way of gathering data is to collect right where it is generated. By digitizing your operation and bringing your machines online, you can easily access key performance metrics at the shop floor level.
Here are some ways you can collect data:
1. Machine Monitoring
Machine Monitoring helps you contextualize machine performance within complex industrial processes in real-time. You can measure uptime, downtime, and idling time, and it’s one of the easiest ways of calculating OEE vs. OPE.
The data collected from monitoring your assets can help you increase throughput in two ways:
1. You can solve problems right there and then by the people who own that problem
2. You can identify long-term bottlenecks through identifying consistently emerging anomalies.
2. Work Instructions
Guided work instructions can help ensure that general tasks and changeovers are done correctly.
Not only can you collect data on worker performance, but you can also error-proof the production process by embedding photos and video, connecting to IoT devices, and capturing images to confirm correct work. This way you can ensure that changeovers and other sensitive processes are always performed to standard.
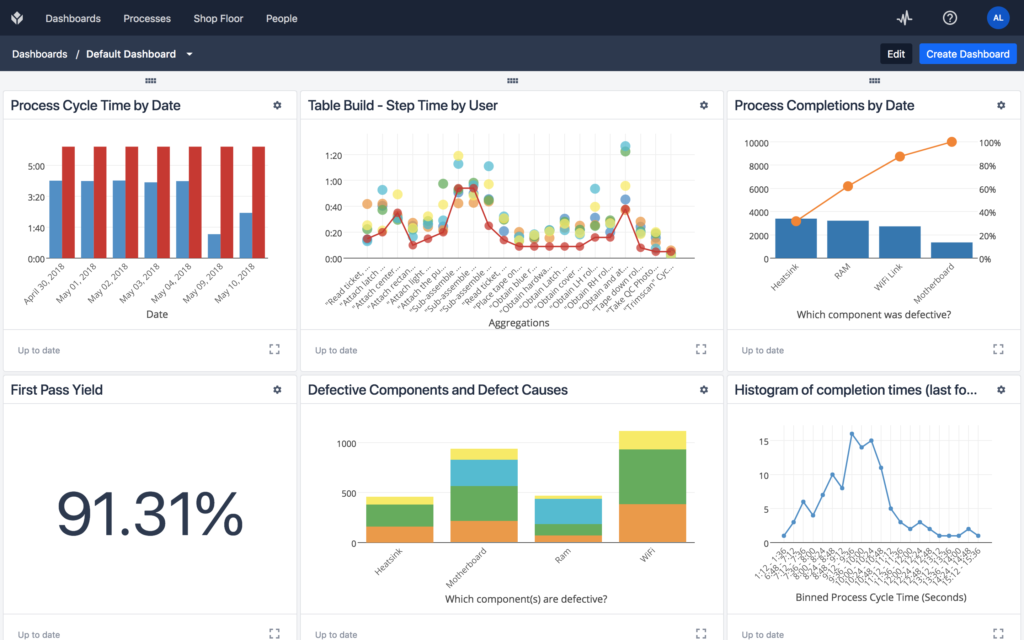
3. Capture Cycle Times
Cycle times help you understand which process from start to finish took the longest, and what its root causes were. By targeting those root causes, you will in turn be able to reduce cycle time, therefore, increasing throughput.
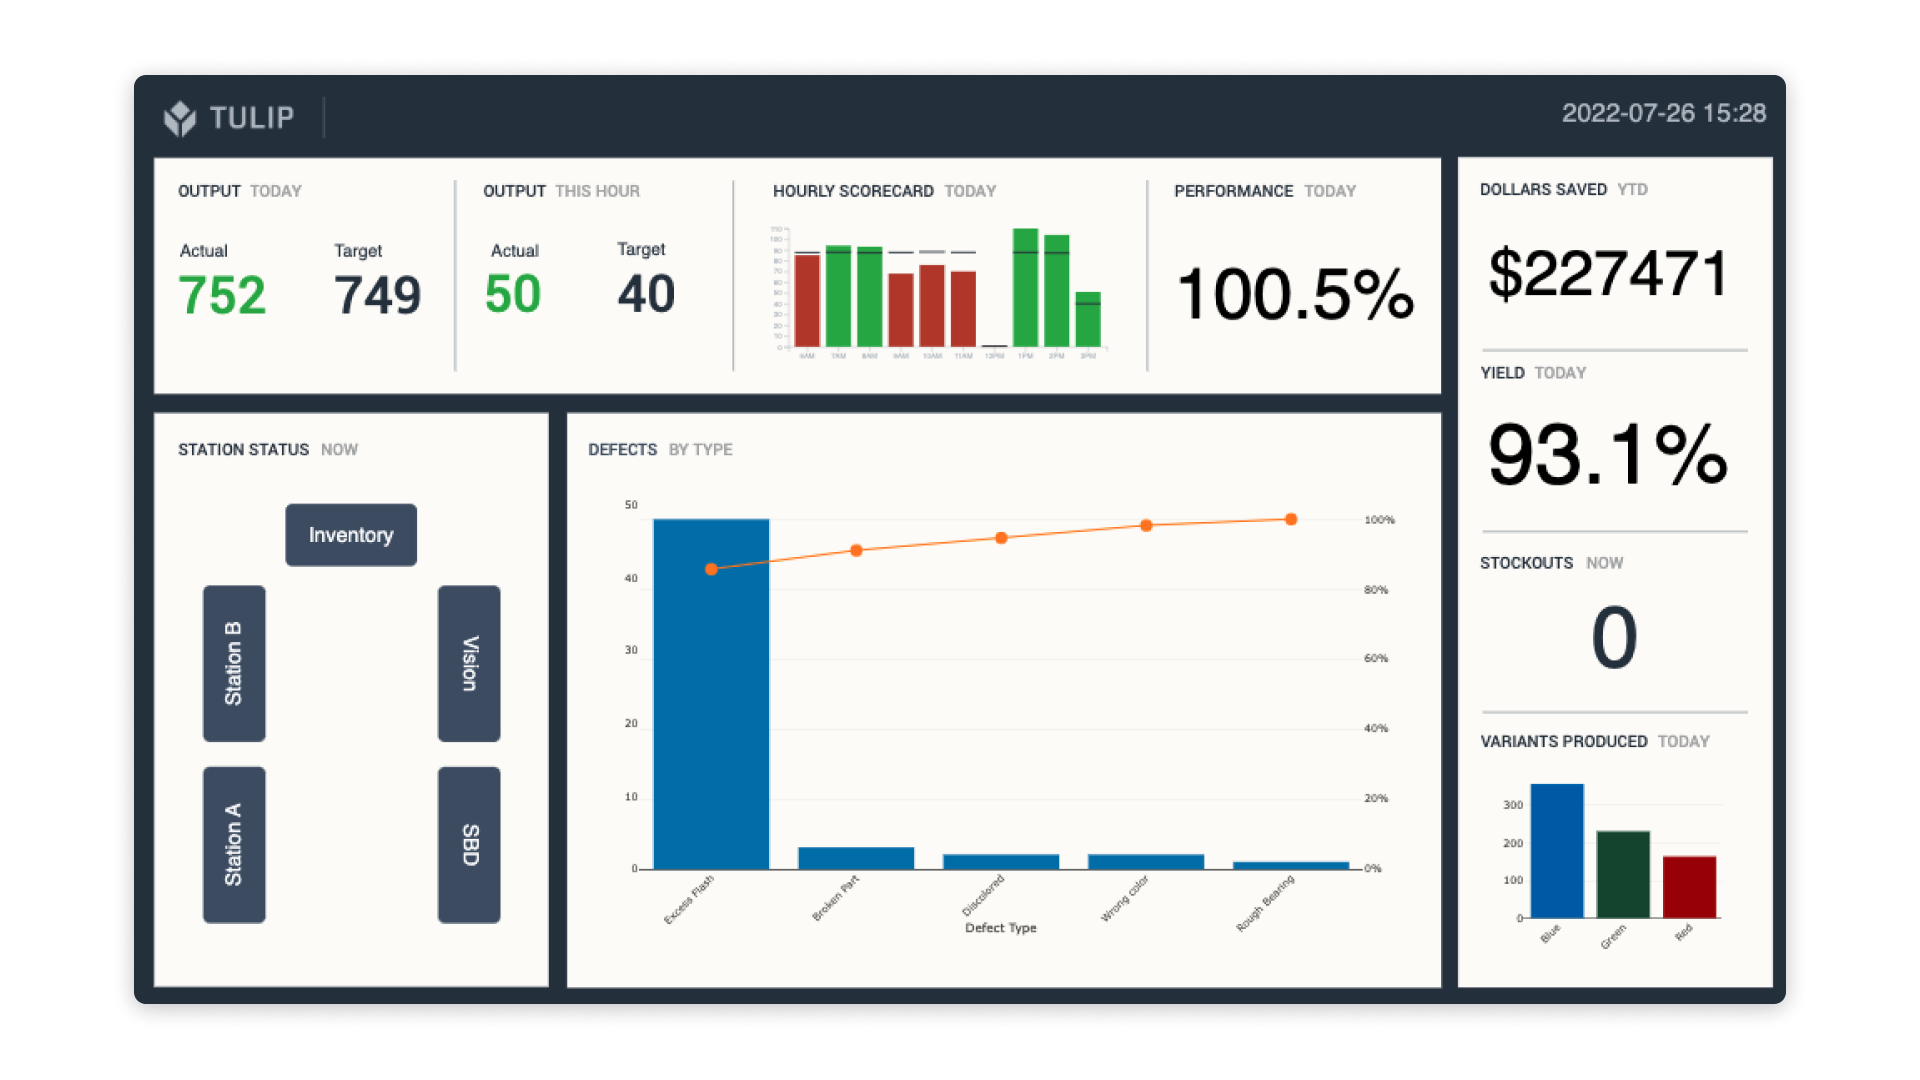
4. Track Production with an Hourly Scorecard
If you identify areas where throughput is a problem, it’s important to be able to correct them quickly. Hourly scorecards help visualize which lines, cells, and assets are performing as expected, and which might need attention.
The Benefits of Collecting Data Digitally
There are countless benefits to collecting data digitally. But to pick a few, there is data accessibility, usability, and legibility.
Digital data allows the entire organization to have immediate access to key production metrics. Whether that person is a shopfloor worker, an operator, or in management, data becomes available to all.
This leads to digital data’s usability. Since digital data is much easier to sort through, categorize, and analyze, the speed at which you can process data is much faster than manually recorded data.
Last but not least, digital data is available to everyone. And because the data can be recorded at consistent, high quality, it encourages workers to record in greater detail.
Conclusions
Diagnosing the root cause of low throughput can be challenging. It’s extra challenging if you don’t have the right data.
The easiest way to start collecting that data is to bring your operations online.
If you want to understand what bottlenecks are keeping you from increasing your throughput, reach out to a member of our team today!
Improve your ability to track throughput and speed up production with Tulip
Automate data collection and gain real-time visibility of production against your targets with a 30-day free trial of Tulip!